|
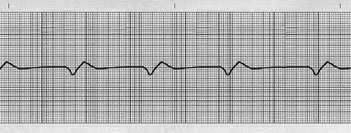
1) This tracing is from an unconscious elderly male. What is happening
here? The heart rate is about 44 per minute. Can you tell us more about
the status and prognosis of this comatose patient from his rhythm strip?
From Rapid Interpretation of EKG's copyright © 2017 COVER Publishing Co. Inc. |
Although
tracings displaying marked bradycardia with wide ventricular complexes
are often categorically called "complete (third degree) AV block" [ pages 186-189 ], this may not always be so. We need to inspect such rhythms
closely for critically important prognostic information.
This
tracing reveals a dire problem. Although it is indeed a type of ventricular
escape rhythm
[ page 117 ], there is no atrial
activity (i.e., no P waves or P' waves), because there is a complete failure
of the SA node, as well as total failure of all atrial and AV nodal (Junctional)
backup pacemakers -- a very ominous prognostic sign. This is "downward
displacement of the pacemaker" [ pages 117, 190 ],
which is characterized by supraventricular (backup) pacemakers that cannot
function due to an overwhelming pathological process -- in this case a
massive infarction.
With
a diagnosis of downward displacement of the pacemaker, signs of further
cardiac deterioration are: progressive widening of the ventricular complexes,
diminishing amplitude of ventricular complexes, and progressive slowing
and irregularity of the ventricular rate. However, contemporary medical
professionals don't abandon resuscitation efforts unless clinical death
is present or irreversibly immanent.
The
astute response of Dr. Sidney Soares of Fortaleza, Brazil has earned him
an inscribed copy of the new color 6th edition of Rapid Interpretation
of EKG's. Thank you Dr. Soares!
____________________
____________________
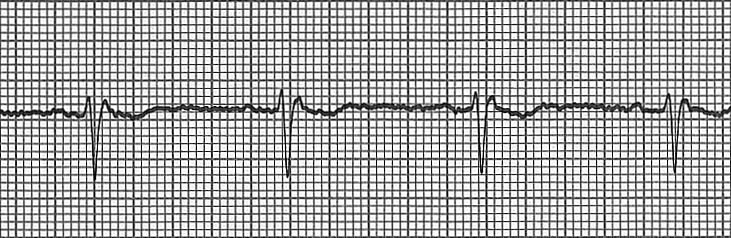
2) This section of an EKG tracing of lead I is from a middle-aged gentleman.
It was recorded in an emergency room. Is he a candidate for anticoagulation?
What are all the diagnostic features of this EKG strip that was printed
out from his cardiac monitor?
From Rapid Interpretation of EKG's copyright © 2017 COVER Publishing Co. Inc.
Most
responders to this EKG were seduced by the conspicuous jagged baseline
[ page 110 ], which is typical of atrial fibrillation (AF). However, and
perhaps more importantly, we know that AF produces an irregular ventricular
response [ pages 165, 166 ], because only random
atrial depolarizations traverse the AV node to depolarize the ventricles.
In
this tracing, the regular ventricular rhythm indicates a normal pacemaker,
which we can identify as the SA node (careful inspection reveals P waves
and normal PR intervals). This is a normal sinus rhythm [ page 98 ], ruling
out AF, so anticoagulation is not necessary.
Skeletal
muscular activity or electrical interference from electrical equipment
can produce a deceptively jagged baseline. Don't be fooled by an irregular
baseline of an EKG; check the regularity of the QRS complexes to be certain.
Congratulations
and an inscribed 6th edition copy have gone out to Dr. Donald Phillips,
a family practitioner from Hobart Indiana (USA), who also noticed the
probable bundle branch block pattern of the QRS complexes [ pages 192-198 ]. And, because the QRS is negative in this lead
I tracing, there is Right Axis Deviation [ pages 221,
222 ], so the patient may have a posterior hemiblock
[ pages 301, 302 ].
____________________
____________________
3) This is an EKG tracing of a lady in her fifth decade. She has objective
symptoms of palpitations. The savvy emergency room physician correctly
identified the medication that the patient has been taking chronically.
Can you? The doctor decided to do a quick diagnostic (not therapeutic)
massage of the patient's left carotid bifurcation. Why?
This short tracing reveals a wealth of diagnostic information. How much
can you detect?
From Rapid Interpretation of EKG's copyright © 2017 COVER Publishing Co. Inc.
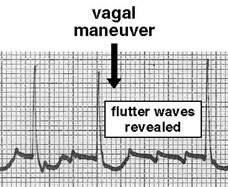
Yes,
this is some kind of narrow QRS tachycardia with a ventricular rate of
about 150 per minute. The apparent P waves appear to precede the QRS's
at varying PR intervals, yet each QRS is preceded by a single atrial depolarization.
But Dr. Park of Seoul, Korea was not bewildered by this EKG strip; he
suggested that there may be atrial waves hidden by each QRS, and he
also suggested that a vagal maneuver [ page 61 ] be attempted to expose
any hidden
atrial activity
[ page 160 ].
From Rapid Interpretation of EKG's copyright © 2017 COVER Publishing Co. Inc.
A
vagal maneuver retards AV node conduction, delaying the next QRS complex,
revealing an uninterrupted series of atrial depolarizations, exposing
a (regular) atrial rate of 300
per minute in this patient. This must be atrial flutter with 2:1 AV
conduction
[ page 159 ].
Dr.
Park also noticed ST depression with characteristics that are typical of "digitalis effect" [ page
317 ]. Indeed, a digitalis preparation was given to the patient
in order to depress the AV node enough to produce a higher ratio of AV
conduction (e.g., 3:1 or so). The patient eventually responded to the
medication, resulting in a more physiological ventricular response rate
(not shown here).
____________________
____________________
4) This is a piece of an EKG from a collection of unusual tracings. No
information accompanied the tracing. Can you provide any reasonable explanation
of the physiological events that might have produced this EKG strip?
From Rapid Interpretation of EKG's copyright © 2017 COVER Publishing Co. Inc.
Some
responders called this Wenckebach (second degree) AV block [ page 180 ]. But notice how the PR intervals are all identical,
and the 4th P wave is missing; these findings are not consistent with
Wenckebach.
Is
this the worrisome intermittent Mobitz [ pages 199, 200 ]?
No, Mobitz also produces a P wave without a QRS response.
Notice
that after three cycles, the expected fourth P wave is absent, so there
must be a sinus block (SA node block) [ page 174 ], and after the resulting
pause, a Junctional focus escapes to fire an escape beat [ page
120 ], producing a normal-looking QRS.
We
are grateful to Olga Smirnova, MD ("from Russia with love"), who was sent
an inscribed book for her diagnostic acumen and EKG savvy.
____________________
____________________
5) This tracing is from a retired gentleman who was monitored remotely
from his hospital room. The floor nurse noticed some "peculiar" activity
on the monitor screen, so she immediately printed this strip of EKG tracing.
Is this a cardiac emergency? What should be done next?
From Rapid Interpretation of EKG's copyright © 2017 COVER Publishing Co. Inc.
Although
there were many persons who, upon seeing this disturbing EKG tracing,
wanted to call for a defibrillator, some noticed that it was probably
innocuous. In fact, this patient was calmly speaking to friends as the
EKG was being recorded.
If
you take a casual look at the short amplitude deflections near the baseline,
you will see that they are much smaller than the tallest deflections that
look like QRS complexes (because they are QRS's!). The low amplitude complexes
are atrial spikes of atrial fibrillation [ pages 110,
165, 166 ], and the taller deflections are the irregular ventricular
responses.
The
problem is that the sensitivity (sometimes called "gain") control of the
cardiac monitor was set so high that the atrial fibrillation caused exaggerated
deflections, and the QRS complexes in the monitored lead were relatively
short by comparison.
Of
the correct responders, one was a medical student from California who
was very deserving of the inscribed copy of the 6th edition. She preferred
to remain anonymous.
____________________
____________________
6) This is a section of a twelve lead EKG. The tracing strip below is
from lead V2. The pattern on the tracing repeats continuously. Can you
identify the underlying mechanism(s) causing what you see on the tracing?
How serious is it?
From Rapid Interpretation of EKG's copyright © 2017 COVER Publishing Co. Inc.
This
bizarre tracing is easy to decipher once we examine the first cycle, which
has an extended, depressed ST segment and a peculiar T wave. The T wave
of the following cycle is extremely tall because a premature P' has occurred
on top of the T wave [ see first Note, page 124 ].
Being
so premature, the P' reaches the AV node while it is still refractory
and conduction cannot occur. This "non-conducted premature atrial beat"
[ page 128 ] does not reach the ventricles, but
it does reset the SA node [ pages 125, 126 ], causing
a brief pause in pacing. This irregular rhythm is not serious.
The
series of two cycles followed by a pause repeats, and therefore looks
somewhat like intermittent Mobitz [ pages 199, 305 ],
which does have serious implications. You should know how to distinguish
between these two look-alikes [ page 200 ], since
the prognosis is so different for each.
This
rhythm is so common that all medical personnel will see it soon in a clinical
setting... if you look for it.
Narinderpal
Singh, MD of Chandigarh, India was the first person to interpret this
tracing.
____________________
____________________
7) This is a tracing recorded in lead MCL1, the improvised lead V2 that
can be recorded by three electrodes on the patient's chest. Can you explain
what caused this unusual tracing?
From Rapid Interpretation of EKG's copyright © 2017 COVER Publishing Co. Inc.
The
first two cycles in this EKG strip are normal, even though the T wave
is isoelectric. The third cycle by itself is also normal, however, a P'
wave from an irritable atrial automaticity focus occurs during (and is
superimposed on) the T wave.
The
P' wave is so premature that it reaches the AV node which is still refractory,
so the depolarization stimulus does not conduct to the ventricles (non-conducted
premature atrial beat
[ page 128 ]). Also, the
SA node is reset [ pages 125, 126 ] by the P' wave,
delaying the next paced P wave. The pause elicits a Junctional escape
beat from an automaticity focus in the AV node, producing a normal-looking
QRS. The sinus rhythm then resumes.
Remember: non-conducted
premature atrial beats are a benign imitator of intermittent Mobitz
[ pages 199, 200 ] .
Thanks
to Dr. W. M. of London for the correct interpretation.
____________________
____________________
8) This tracing (unidentified lead) is from an elderly lady who was being
transported by an emergency vehicle to a hospital. The EMT happened to
notice a rapid rhythm that appeared suddenly. He correctly identified
the arrhythmia. Can you explain the rhythm?
From Rapid Interpretation of EKG's copyright © 2017 COVER Publishing Co. Inc.
This
is an obvious tachycardia of about 150 per minute. The diphasic P wave
(suspect atrial hypertrophy[ pages 247-249 ])
attracted the attention of some responders. The P wave and the T wave
appear so similar as to make some consider this a tachycardia with 2:1
AV conduction
[ page 150 ], which it is not.
Although
similar in appearance, the spikey P and T waves do not produce the predictable
continuity of timing that one expects with a paced rhythm produced by
the same repeating wave. This rhythm is a supraventricular tachycardia
[ page 153 ], probably atrial [ page 149 ].
However,
the real lesson in this tracing is that in their zeal to identify the
rhythm, all the responders overlooked the obvious and MOST IMPORTANT FEATURE.
First
of all, every ventricular complex is a QS [ page 25 ]
in form; this is the same as a Q wave. Now you see the importance!
Second,
all ST segments are markedly elevated [ pages 266, 267 ].
Very important!
Third,
all T waves are peaked, hyperacute T waves [ pages 354,
355 ], a marker of acute infarction.
This
answer is posted without waiting for a correct response. It can serve
as a reminder to acute care-givers that arrhythmia identification is important,
but not to the extent that a large, acute anterior infarction (this case)
is overlooked.
____________________
____________________
9) This EKG was printed from a monitor with the gain (sensitivity) set
too high. Since the overzealous setting of the monitor occurred on the
previous shift, the (unaware) nurse viewing the tracing was a little confused
by the high amplitude waves. Can you help?
From Rapid Interpretation of EKG's copyright © 2017 COVER Publishing Co. Inc.
This
is an EKG taken from a lead in which the QRS is nearly isoelectric, and
both the upward and downward deflections are minimal. To make the display
easier to see on cardiac monitor, the nurse increased the sensitivity
(gain) to the extent that the P waves were so vertically magnified that
they looked like PVC's.
This
patient has a normal sinus rhythm (rate 75 to 100). Once we realize that
the largest waves are the P waves, we know that this is a 2:1 AV block
[ pages 182, 183 ], most likely Wenckebach.
Most
important is the ventricular rate, which is in the low 40's. If this patient
is hypotensive or if the carotid arteries are a little narrowed by atherosclerosis,
a pulse in the low 40's may not be sufficient to sustain consciousness
(Stokes-Adams syndrome [ page 189, see last Note ]).
Airway! An unconscious patient with a compromised airway can quickly become
a dead patient.
Thanks
to Dr. George C. Griffith (1898-1975), who first explained to the author
how bradycardia causes unconsciousness.
If
you have any comments or further explanations on the above tracings submit
them to: [email protected]
An
inscribed copy of Rapid Interpretation of EKG's was sent to the winner(s)
with the best analysis.
|